

Oct 27, 2026 · 7 min
Bollinger Bands Settings: Is 20, 2 Right for 5-Min Charts?
Everyone runs Bollinger Bands at 20 and 2. Its inventor calls them defaults, and a simulation shows what 10 and 1.5 does to how often price pokes out.
arthur
Everyone runs Bollinger Bands at 20 and 2. Its inventor calls them defaults, and a simulation shows what 10 and 1.5 does to how often price pokes out.
Same pair, same timeframe, two different RSI readings. Smoothing method and warm-up history explain it, and the gap can be several points.

The COT report shows Tuesday's positioning every Friday. A peer-reviewed backtest found the edge mostly disappears once you try to trade it.

The famous 5-minute opening range breakout paper reports 1,637%. Its unfiltered baseline made 3.2% a year. What the tables show, and what they skip.

Everyone recycles '2x to 3x ATR' for stop losses. Here's where that number actually comes from, and why copying it is the wrong move.

Anchored VWAP has exactly one real input. Pick it after the move and you have built a hindsight machine. Here is how to pick it by rule instead.

Thirty trades cannot tell a winning system from a losing one. The arithmetic that sets your real sample size, and why every variant you tried raises it.

A walk through 15 of the most-used trading strategies — what they are, typical win rates, risk-reward ratios, and which indicators each one runs on.

Most retail traders pick instruments by accident — the asset their broker pushes, the asset they saw on social. This pillar guide walks through the eight-question asset selection framework Tradoki teaches, across forex, crypto, stocks, indices, commodities, and REITs.

The ten-month story of why Tradoki exists, what we tried first, what we threw away, and the specific decisions that shaped the company we ended up running.

Trading the initial spike on a high-impact economic print is one of the most reliable ways to lose money fast. Here is how the news-fade pattern actually forms and why retail keeps walking into it.

Volume profile is a useful map of where price has done business. It is also a discipline that has been turned into a cult. Here is how I actually use it without pretending it is magic.

Multi-timeframe top-down analysis fails when it confirms a hunch instead of disqualifying a trade. The three-timeframe framework we use to fix that.

Liquidity sweeps are not the market hunting your stop. They are a structural feature of how price discovers resting orders — and why retail keeps walking in.
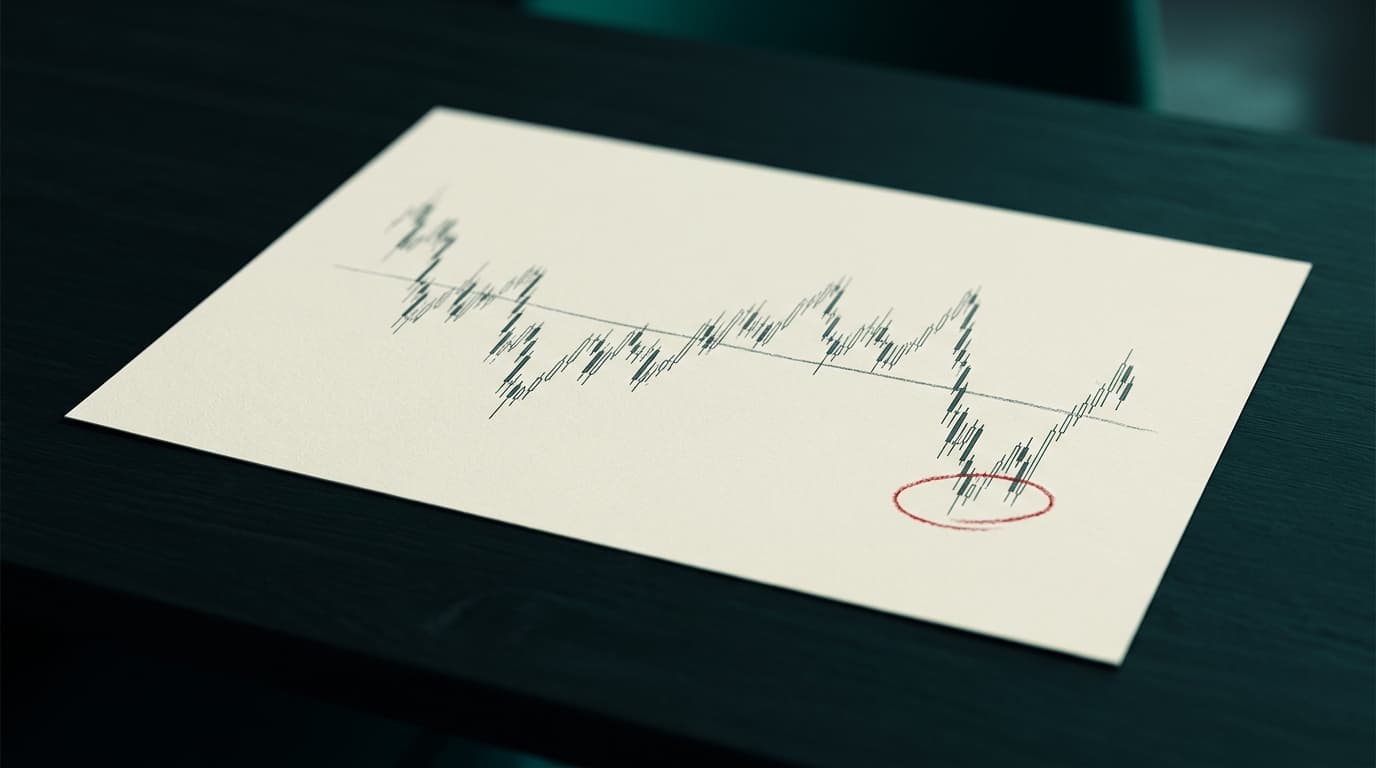
Mean reversion still works in 2026, but only inside narrow regimes. The framework we teach, and the failure modes we see retail traders repeat.